Sample Work
This part of my DP will sample some of my Math/Physics work.
Kinematics (Motion In 1D)
In Motion in 1D we did mini labs to help us learn all about velocity, speed, acceleration, position time graphs, and velocity time graphs. At first some of the information was a bit confusing to me but I feel at the end of this unit I really got an understanding for motion in 1D. For example we had to learn about three different key ideas which were:
- The slope of a position time graph (PT graph) tells us about an objects velocity.
- The slope of a velocity time graph (VT graph) tells us about an objects acceleration
- The area under the graph of a velocity time graph tells us about on objects displacement
Key idea #3 was my favorite, if you look to the left you can see a picture of a vt graph telling as about the displacement of the object. In this case the we would have to find the area of all the places that are shaded. The answer would be 96 because 4*8*0.5=16 and 10*8=80, when you add 80 and 16 you get the displacement of 96 meters. I don't know why but for some reason it blew my mind that I could find the displacement on a vt graph.
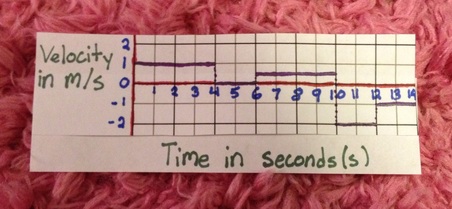
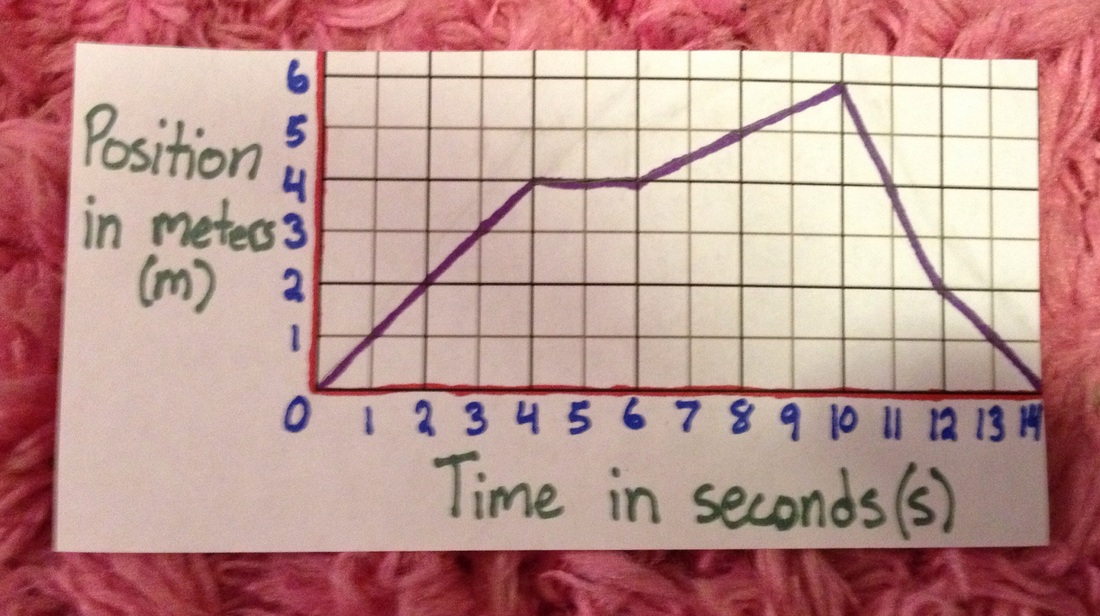
Another fun thing we did was make motion stories for pt and vt graphs. For example Billy, Bob, and Joe went on a bike ride. They started at the bottom of the hill and were going at a nice steady pace of 1 m/s up the mountain for a total of 4s. They all stopped because they saw a mouse. They took some pictures for 2s, then continued up the very steep mountain. They went slower at a pace of 0.5 m/s for 4s because it was so steep. Finally the got to the top of the mountain. Then immediately at arriving at the top, went super fast down the mountain at -2 m/s for 2 seconds. They slowed it down at the end and went down the mountain at -1 m/s till they got all the way down the mountain. Below you can see both the pt and vt graph for this motion story:
Another fun thing we did was make motion stories for pt and vt graphs. For example Billy, Bob, and Joe went on a bike ride. They started at the bottom of the hill and were going at a nice steady pace of 1 m/s up the mountain for a total of 4s. They all stopped because they saw a mouse. They took some pictures for 2s, then continued up the very steep mountain. They went slower at a pace of 0.5 m/s for 4s because it was so steep. Finally the got to the top of the mountain. Then immediately at arriving at the top, went super fast down the mountain at -2 m/s for 2 seconds. They slowed it down at the end and went down the mountain at -1 m/s till they got all the way down the mountain. Below you can see both the pt and vt graph for this motion story:
Velocity Time Graph (VT Graph) Position Time Graph (PT Graph)
|
|
The Escalator Problem
After Taking the Metro to Dupont Circle in Washington, DC, Jess reached street level by walking up the escalator at a brisk rate, taking 42 steps during the trip to the top. Suddenly curious about the length of the escalator, Jess returned to the bottom and walked up the same escalator at a leisurely rate, taking steps one half as often as on the first trip, taking 24 steps in all. How many steps can be seen on the visible part of the escalator?
